

Hybrid work has fundamentally reshaped the modern office. Where desks once sat occupied from nine to five, many now stand empty for days at a time — yet organisations continue paying for every square metre. According to recent research by JLL, the average office utilisation rate hovers around just 40-60% on any given day, meaning a substantial portion of corporate real estate delivers little tangible value. The solution isn’t guesswork or gut feeling. It’s workplace analytics.
By harnessing data from sensors, booking systems, badge swipes, and employee feedback, organisations can finally understand how their space is actually being used — and make intelligent decisions about how to optimise it. This article explores the science behind office space utilisation, the metrics that matter most, and the practical steps needed to build a genuinely data-driven workplace strategy.
What Is Office Space Utilisation?
Office space utilisation refers to how effectively an organisation’s physical workspace is used over a given period. At its simplest, it’s a measure of occupied space versus available space. But true utilisation analysis goes much deeper than a headcount at the door.
Modern utilisation measurement encompasses several dimensions:
- Desk utilisation — how often individual workstations are occupied throughout the day
- Room utilisation — whether meeting rooms, collaboration zones, and breakout areas are being used as intended
- Peak versus average occupancy — understanding daily, weekly, and seasonal fluctuations in footfall
- Space type performance — identifying which categories of space (focus pods, phone booths, social areas) deliver the most value
- Time-based patterns — revealing when employees actually use the office, not just whether they show up
The distinction between occupancy and utilisation matters here. A meeting room might be occupied by one person taking a phone call — technically occupied, but hardly well utilised if it’s designed for twelve. Workplace analytics helps organisations see beyond raw numbers to understand the quality of space usage.
Why Traditional Measurement Methods Fall Short
For decades, facility managers relied on manual walkthroughs, badge data, or simple headcounts to gauge space usage. These methods share fundamental weaknesses: they’re sporadic, labour-intensive, and often misleading.
A facilities team walking the floor at 10am on a Tuesday captures a single snapshot — one that may bear little resemblance to Thursday afternoon or Monday morning. Badge data tells you someone entered the building, but nothing about where they went or what they did. Surveys capture sentiment, but employees are notoriously poor at accurately reporting their own behaviour.
Research from Leesman, a leading workplace experience consultancy, consistently shows a significant gap between how organisations think their space is used and how it’s actually used. This disconnect leads to costly mistakes: oversized meeting rooms sitting empty whilst employees queue for phone booths, or prime real estate dedicated to storage when collaboration space runs short.
The Core Metrics of Workplace Analytics
Effective space optimisation begins with understanding which metrics to track. Not all data is equally valuable, and drowning in numbers without a clear framework leads to analysis paralysis rather than actionable insight.
1. Utilisation Rate
The foundational metric. Calculated as the percentage of available workstations or spaces actually in use during a defined period, utilisation rate provides a baseline for all further analysis. A desk utilisation rate of 35% on Mondays versus 75% on Wednesdays tells an immediate story about hybrid working patterns — and suggests opportunities for flexible desk policies.
2. Peak Occupancy
Understanding your busiest periods matters more than averages. If your office reaches 90% capacity every Tuesday but averages just 45% across the week, you need space planning that accommodates peak demand without maintaining excess capacity the rest of the time. Peak occupancy data informs decisions about meeting room ratios, collaborative space provision, and even cleaning schedules.
3. Space Type Ratio
How many desks do you have relative to collaboration zones, quiet rooms, and social spaces? Workplace analytics reveals whether these ratios match actual behaviour. Organisations frequently discover they have too many individual desks and too few video-call-friendly spaces — a legacy of pre-pandemic office design.
4. Dwell Time
How long do people spend in different areas? Short dwell times in collaboration spaces might indicate they’re too noisy or poorly equipped. Extended dwell times at desks in supposedly “activity-based” environments might suggest employees lack suitable alternatives for focused work.
5. Booking Versus Actual Usage
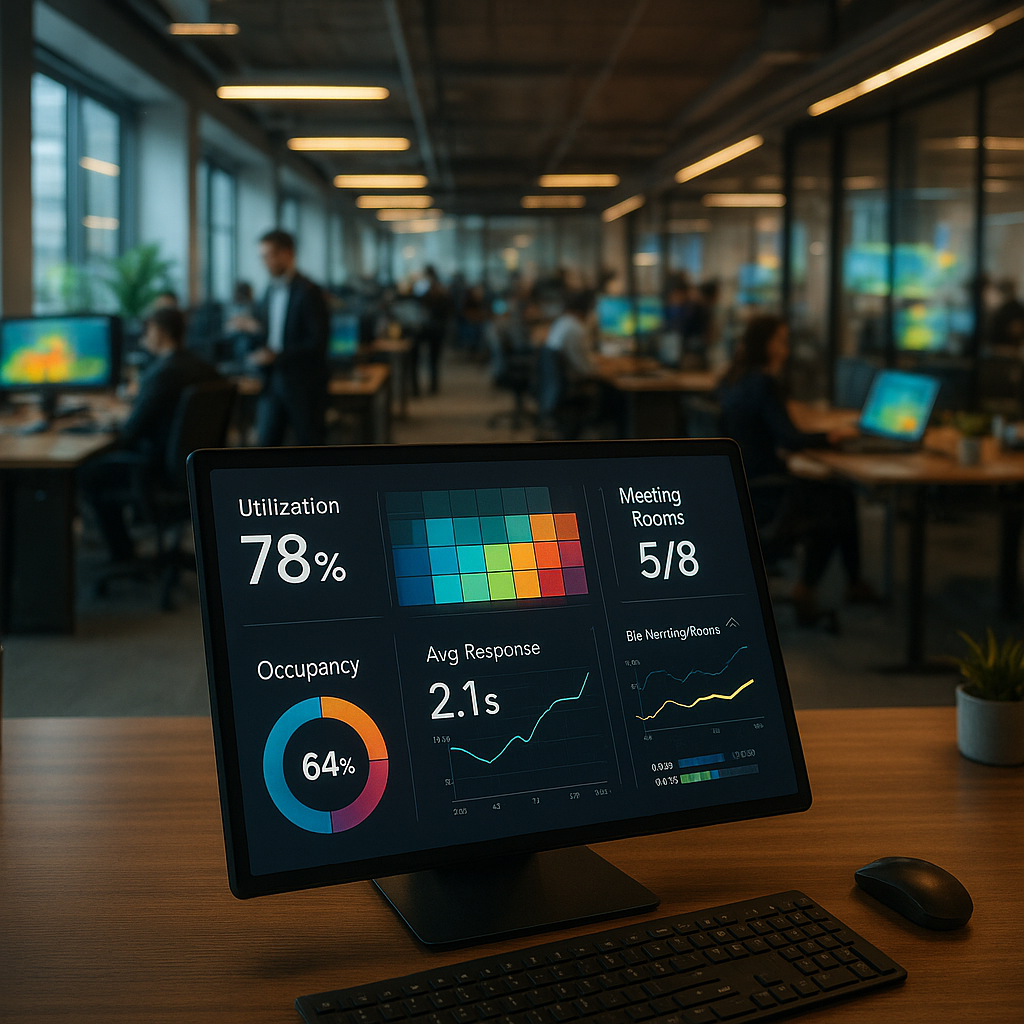
Meeting room booking systems often paint a rosier picture than reality. No-shows, early departures, and “ghost meetings” (booked rooms standing empty) are endemic. Comparing booking data with sensor-verified occupancy exposes this discrepancy, enabling policies like automatic release of unused rooms.
6. Employee Experience Scores
Quantitative data tells you what is happening; qualitative feedback tells you why. Combining sensor data with regular pulse surveys creates a complete picture. Low utilisation of a particular zone might stem from poor lighting, inadequate technology, or simply being too far from the coffee machine — insights no sensor alone could reveal.
Technologies Powering Workplace Analytics
The workplace analytics ecosystem has matured rapidly, offering organisations a range of tools suited to different budgets, privacy requirements, and analytical ambitions.
Occupancy sensors remain the gold standard for granular, real-time data. Ceiling-mounted IoT sensors using passive infrared, computer vision, or ultrasonic detection can track desk-level usage without identifying individuals. Modern systems achieve accuracy rates above 95% whilst maintaining anonymity.
Wi-Fi and Bluetooth tracking leverages existing infrastructure, using device connections to estimate occupancy. Whilst less precise than dedicated sensors, this approach requires minimal capital investment and works well for floor-level or zone-level analysis.
Desk and room booking systems generate valuable behavioural data even before sensors are installed. Booking patterns reveal demand, preferences, and the gap between planned and actual usage.
Integrated workplace management systems (IWMS) combine multiple data sources into unified dashboards, enabling trend analysis, forecasting, and scenario modelling. These platforms increasingly incorporate artificial intelligence to predict future space needs based on historical patterns and business growth projections.
The choice of technology depends on objectives. An organisation seeking to validate a lease renewal decision might need only periodic sensor studies, whilst one implementing dynamic, activity-based working requires continuous, real-time monitoring.
From Data to Decision: A Practical Framework
Collecting data is straightforward. Translating it into meaningful change requires discipline, stakeholder alignment, and a structured approach.
Establish Baselines and Benchmarks
Before changing anything, understand your starting point. Run measurement studies across representative periods — ideally four to six weeks to capture natural variation. Compare your metrics against industry benchmarks, but treat external comparisons with caution; a technology firm’s optimal utilisation differs from a law firm’s.
Identify Quick Wins
Data often reveals immediately actionable insights. Consistently underused meeting rooms can be converted to focus pods or storage. Overcrowded collaboration zones might need additional provision or better distribution across floors. These changes build momentum and demonstrate value before tackling more complex challenges.
Model Different Scenarios
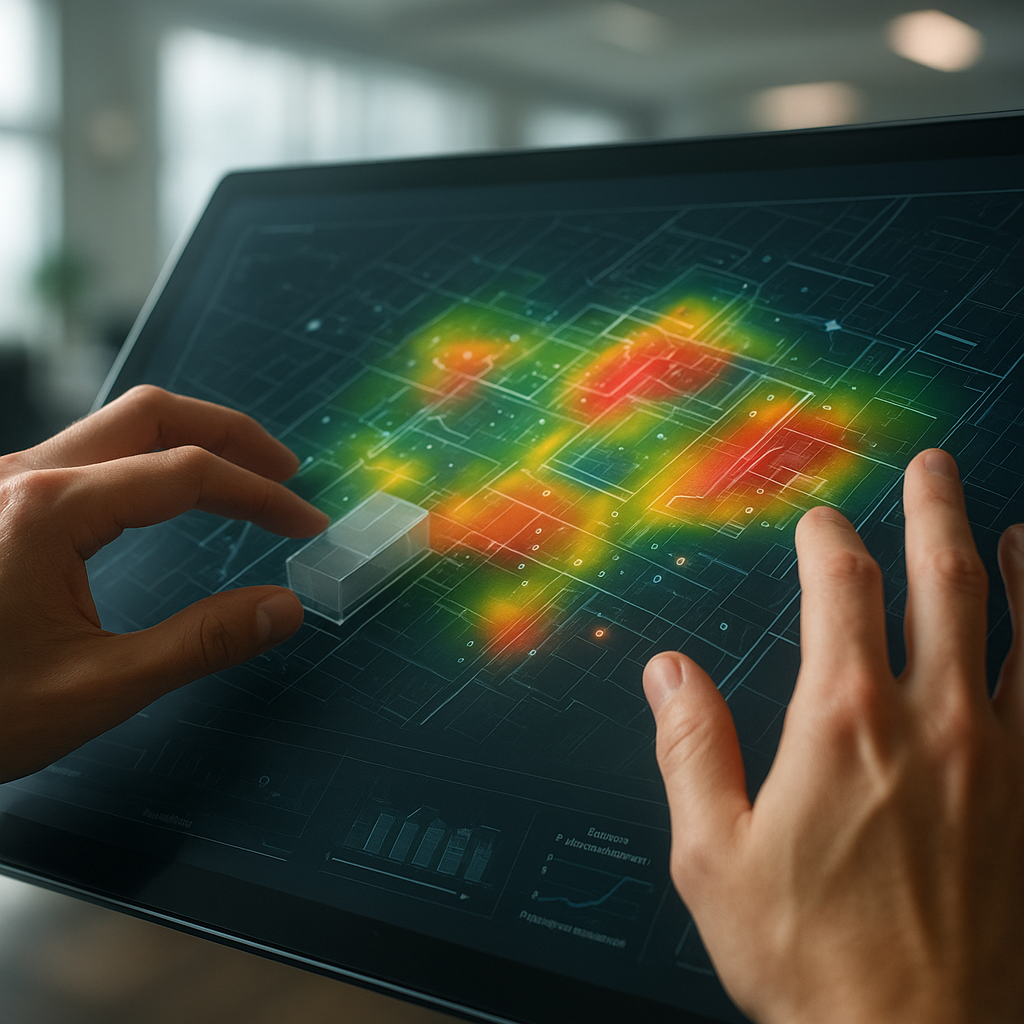
Workplace analytics platforms increasingly support “what-if” analysis. What happens to peak demand if you shift to a four-day office week? How much space could you release if desk sharing reached 80% adoption? Scenario modelling transforms abstract data into concrete business cases.
Test and Iterate
Major workplace changes carry risk. Pilot programmes — converting a single floor, trialling new space types with volunteer teams — allow organisations to validate assumptions before committing capital. Analytics then measures the impact, creating a feedback loop of continuous improvement.
Navigating Privacy and Cultural Challenges
Workplace analytics operates in sensitive territory. Employees rightly expect privacy, and poorly communicated monitoring programmes can damage trust irreparably.
Successful implementations share common characteristics:
- Transparency — clearly communicating what data is collected, how it’s used, and crucially, what is not being tracked (no individual monitoring, no performance evaluation)
- Aggregation — focusing on patterns and trends rather than individual behaviour, with data anonymised and reported at team or zone level
- Employee benefit — demonstrating how analytics improves the workplace experience, not just reduces costs
- Legal compliance — adhering to GDPR and similar regulations, with proper data protection impact assessments
The cultural dimension extends beyond privacy. Data may reveal uncomfortable truths — that prestigious corner offices sit empty, or that the expensive refurb didn’t change behaviour. Organisations must be prepared to act on evidence, even when it contradicts executive preferences.
The Future of Data-Driven Workplace Design
Workplace analytics is evolving from retrospective reporting to predictive intelligence. Machine learning algorithms now forecast space demand based on calendar data, project timelines, and even weather patterns. Digital twins — virtual replicas of physical offices — allow facility managers to simulate changes before implementation.
Integration with building systems promises further efficiency. Analytics-informed HVAC and lighting adjust automatically to actual occupancy, reducing energy consumption alongside space costs. The Environmental, Social, and Governance (ESG) reporting agenda adds urgency; accurate utilisation data is essential for credible sustainability reporting on Scope 3 emissions from commuting and office operations.
Perhaps most significantly, workplace analytics is shifting the conversation from “how much space do we need?” to “what kind of space enables our best work?” The organisations thriving in hybrid work aren’t necessarily those with the smallest footprints — they’re those with the most intentional, evidence-based approach to what that footprint contains.
Conclusion
Office space utilisation is no longer a facilities management afterthought; it’s a strategic lever affecting cost, culture, sustainability, and talent attraction. The organisations succeeding in this new landscape share a common trait: they’ve replaced assumption with evidence.
Workplace analytics provides the visibility needed to make confident decisions — whether that’s renegotiating a lease, redesigning a floor plate, or simply understanding why nobody uses the third-floor breakout area. The metrics matter, from utilisation rates and peak occupancy to the softer signals of employee experience. The technology has matured to deliver these insights reliably and ethically.
Yet data alone changes nothing. The organisations that thrive combine analytical rigour with willingness to experiment, iterate, and occasionally acknowledge that the evidence points somewhere unexpected. In the era of hybrid work, that combination — insight plus adaptability — is what transforms office space from fixed cost into genuine competitive advantage.